Socials
Twitter: https://twitter.com/Mako_Sec GitHub: https://github.com/MakoSec
Materials Used
- x64 Debugger
- Frida
- Sysinternals
- Unhooking DLL source code
https://www.ired.team/offensive-security/defense-evasion/how-to-unhook-a-dll-using-c++
References
The DLL unhooking code used in this blog post came from here. Ired.team is a great resource for offensive security techniques and I reference the material on there quiet frequently. I do not claim ownership or credit for this code, all of that goes to @spotheplanet.
Disclaimer
I am not a DFIR specialist. I work in the offensive side of security. However, as a way to share knowledge and understand the short comings of some offensive security techniques, I decided to look into how a popular technique to bypass user-land EDR hooks can be detected. In this post I’ll be going over the tools and methods I used to search for ways to detect this technique. I fully expect I will make mistakes throughout the process of this post and if any DFIR wizards are reading this, I would love to hear how you would go about it!
Introduction
A big part of EDR functionality is their ability to inject a DLL into running processes and hook certain Windows API calls to monitor for malicious uses. For example, an EDR solution might hook a call such as VirtualProtect and alert if it detects PAGE_EXECUTE_READWRITE in the flNewProtect parameter. This is important functionality and something that Red Teamers or adversaries will be looking to bypass. One of the ways to bypass this EDR functionality, is to map a clean version of the targeted DLL and swap the .text sections. This causes the .text section of the currently loaded version of the targeted DLL to be replaced by a clean version, free of hooks.
Ntdll Loaded Twice
The biggest indicator for this technique is that the targeted DLL will be loaded twice. Part of the way Windows runs executable files is that each executable automatically loads 3 DLL’s. These DLL’s are ntdll.dll, kernel32.dll, and kernelbase.dll. This behavior can be observed in a couple of ways. First, in a debugger, open the unhooking executable and step through the code. Initially, you will see 4 loaded libraries. The three mentioned above and a DLL that gets injected by BitDefender.
As you step through the code you will eventually see that ntdll.dll is loaded a second time into process memory.
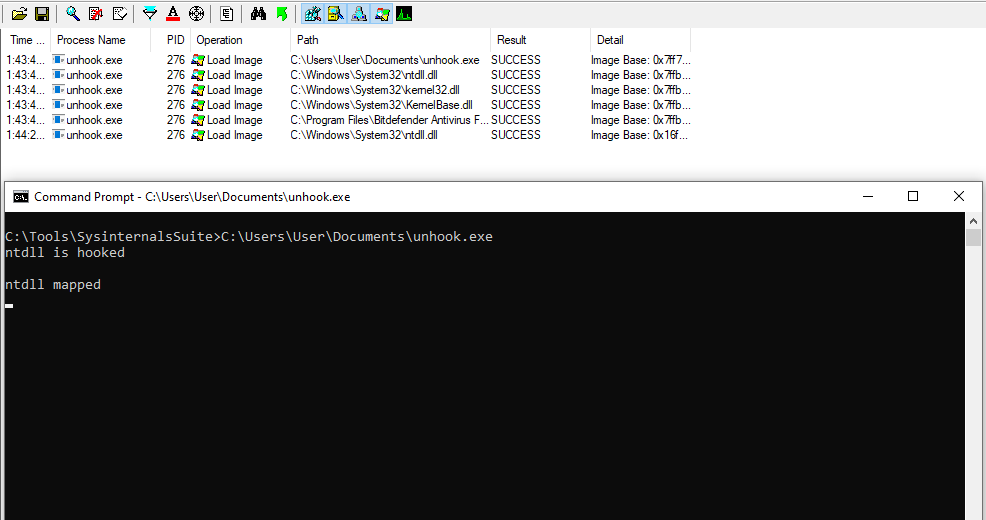
Another way to view ntdll.dll being loaded a second time is through Procmon, provided by sysinternals suite. What was interesting, was while a LoadImage event appeared in Procmon, I was unable to view that same behavior in Sysmon. To view this behavior in Procmon, start procmon.exe and add the filters Process Name contains (executable name) and Operation Is LoadImage. Upon running the executable to unhook ntdll, you will see the initial libraries being loaded, and then ntdll will be loaded a second time.
Ntdll Loaded At Unpreffered Address
Piggy backing off of the previous section, the new copy of Ntdll will be loaded at an unpreffered memory address. If you are unfamiliar with the way ASLR (Address Space Layout Randomization) works on Windows, executables, libraries, etc are given a prefered address. This preferred address will remain the same until the computer is restarted, which will cause a new preferred address to be assigned. In the case of ntdll.dll, if the preferred address is 0x12345678, then each copy of ntdll.dll will be loaded at that address. This is definitely not the most obvious or useful indicator for this technique but it could be interesting.
Tracing API Calls With Frida
The last thing I used to analyze the unhooking behavior was frida-trace. This tool makes it very easy to do analysis on executables and I have not even begun to scratch the surface of its usefulness. Windows has a lot of libraries and any given executable will make a ton of Windows API calls. That means tracing every single call with frida would be impractical and take much too long. Instead, since I knew this technique relies on API calls such as CreateFileA, CreateFileMapping, and MapViewOfFile. I only focused on those calls. To start tracing with frida, run the command frida-trace -f <path to exe> -I KERNELBASE.DLL -i Create* -i Map*. This will create a bunch of JS files in a directory titled handlers. These handlers can be edited to print the parameters and return value of Windows API calls. Let’s first look at the structure for how the new copy of ntdll is mapped into memory by looking at this code section.
HANDLE ntdllFile = CreateFileA("c:\\windows\\system32\\ntdll.dll", GENERIC_READ, FILE_SHARE_READ, NULL, OPEN_EXISTING, 0, NULL);
HANDLE ntdllMapping = CreateFileMapping(ntdllFile, NULL, PAGE_READONLY | SEC_IMAGE, 0, 0, NULL);
LPVOID ntdllMappingAddress = MapViewOfFile(ntdllMapping, FILE_MAP_READ, 0, 0, 0);
First, the file is opened to read with CreateFileA and a handle to the file is returned. This handle is used by the CreateFileMapping call to prepare the file to be mapped into memory. The handle created by CreateFileMapping is then used by MapViewOfFile to actually map the new copy of ntdll into memory. This can be observed in Frida by editing the JS handler files to output what we want to see. If you open one of the handler files you will see two functions, onenter and onleave. The onenter function takes a few parameters, the imporant one right now being args. Args, is an array of the arguments provided to the targeted Windows API call. You can use msdn to get the function definitions in C and translate that to JS. For example, the structure of the CreateFileA call looks like this.
HANDLE CreateFileA(
  LPCSTR                lpFileName,
  DWORD                 dwDesiredAccess,
  DWORD                 dwShareMode,
  LPSECURITY_ATTRIBUTES lpSecurityAttributes,
  DWORD                 dwCreationDisposition,
  DWORD                 dwFlagsAndAttributes,
  HANDLE                hTemplateFile
);
Translating that into something Frida can interprept will look like this.
onEnter(log, args, state) {
    log('[*] CreateFileA()');
    log('|__> lpFileName: ' + args[0].readUtf8String());
    log('|__> dwDesiredAccess: '+ args[1]);
    log('|__> dwSharedMode: ' + args[2]);
    log('|__> lpSecurityAttributes: '+args[3]);
    log('|__> dwCreationDisposition: '+args[4]);
    log('|__> dwFlagsAndAttributes: '+args[5]);
    log('|__> hTemplateFile: '+args[6]);
  }

  onLeave(log, retval, state) {
    log("|__> Exiting CreateFileA");
    log("|__> retval: " +retval);
  }
Here is the onenter and oneleave functions I created for CreatFileMapping and MapViewOfFile.
onEnter(log, args, state) {
    log('CreateFileMapping()');
    log('|__> hFile: '+args[0]);
    log('|__> lpFileMappingAttributes: '+args[1]);
    log('|__> flProtect: '+args[2]);
    log('|__> dwMaximumSizeHigh: '+args[3]);
    log('|__> dwMaximumSizeLow: '+args[4]);
    log('|__> lpName: '+args[5].readUtf8String());
    log('[+] Return: ' + Memory.readUShort(args[6]));
    this.resultPointer = args[6];
  }

onLeave(log, retval, state) {
    log("|__> Exiting CreateFileMappingA");
    log("|__> retval: "+ retval);
  }

onEnter(log, args, state) {
    log('MapViewOfFile()');
    log('|__> hFileMappingObject: '+args[0]);
    log('|__> dwDesiredAccess: ' + args[1]);
    log('|__> dwFileOffsetHigh: ' + args[2]);
    log('|__> dwFileOffsetLog: ' + args[3]);
    log('|__> dwNumberOfBytesToMap: ' + args[4]);
    log('[+] Result: ' + Memory.readUShort(args[5]));
}

onLeave(log, retval, state) {
    log('Leaving MapViewOfFile');
    log('|__> retval: ' + retval)
  }
Once the code is added to their respective handler files and frida-trace is re-ran, the ouput will look as follows.
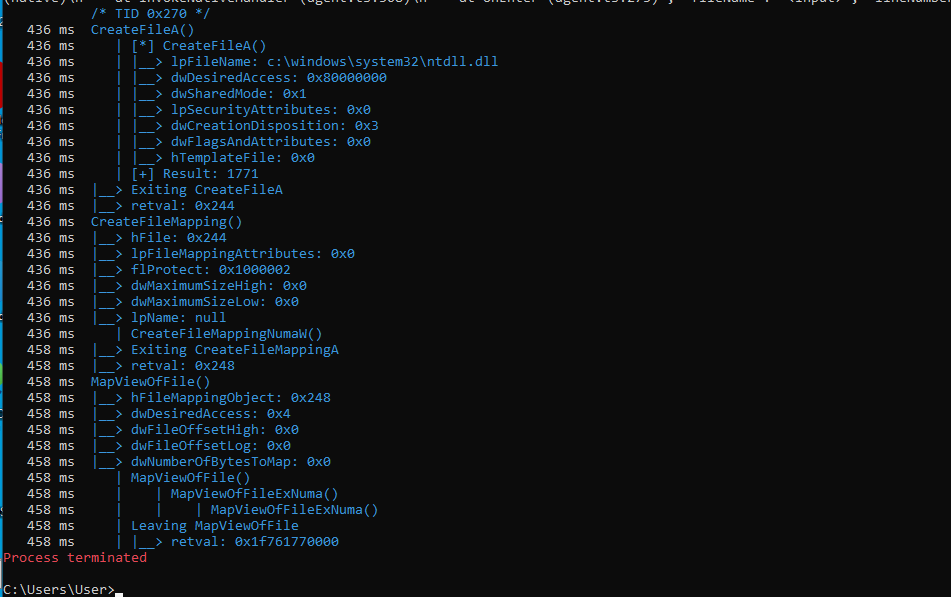
Stepping through the source code should reveal how these calls are all interconnected. For example, the return value of CreateFileA is a handle with a value of 0x244. This handle is used by CreateFileMappingA which returns another handle of value 0x248. This handle is then consumed by MapViewOfFile. This shows that whatever file is being accessed in CreateFileA is then being mapped into the current processes memory. In this case, that file is ntdll.dll as shown in the output of lpFileName. Since we have access to the source code, this is pretty obvious. However, even without source code, we can use Frida to paint a clear picture of what is happening.
Conclusion
In this post I showed a few ways to potentially detect an EDR evasion technique. As previously mentioned I am not a DFIR expert and I suspect I missed some things / made some mistakes throughout the course of this post. I would love to hear from any DFIR experts out there on how they would tackle a similar scenario. It is important to mention this analysis will also fail to catch some other known methods of bypassing EDR hooks.